“Kitna deti hai?”(how much does it give) For a country obsessed with mileage, Maruti advertisement hits the right chords. If we follow the newspapers/personal financial books/blogs it is often quoted that equities returns more than 12% while Fixed Deposits give less than 10%. Hence equities should definitely be the part of one’s portfolio for long term infact the formula suggested is 100 – age. But parents say that Real Estate give the best returns. But last few years Gold has given great returns! We have tried to find Returns of various Asset Classes in India over a period of time. But we have not taken taxation into picture. A note of caution Torture numbers, and they’ll confess to anything.
Table of Contents
Note of caution
As we suggested in our article Comparison of Fixed Deposits and Sensex Returns by changing the reference dates, data can present a different picture. For example if 1992 and May 2012 are used as the reference date for comparison for Sensex:
- The BSE Sensex was quoting at 4,285 nearly 20 years ago. It’s now at 17,404(May 2012), an annualised return of a paltry 7.26%, which is well below the current high inflation rate.
- If the same money had been invested in a 1-year fixed deposit with a commercial bank and rolled over every year, it would have grown to Rs 49,722.
- If investors could have opted for five-year FDs that offered higher rates. This corpus would have been bigger at Rs 70,854.
But, if you had entered the Indian market in 1993 instead of 1992, when Sensex was 2,280, you would have got 11.29% returns. Even a year earlier, in 1991, would have yielded a much higher returns of 13.73%.
Our article Ups and Downs of Sensex shows how Sensex went up and down and how it has climbed from 100 in 1979 ! Some say that The Great Indian Stock Market Story of the last twenty years is only about four years, 2003-2007. If you’re finicky, we could add the stellar 1991-92 time when Harshad Mehta pushed the market up 3x in one year and say this: Just five years of the last twenty two have accounted for nearly all of stock market returns
So remember Numbers present one side of the story but what is important to understand is why it happened?
Returns of the different Asset Classes
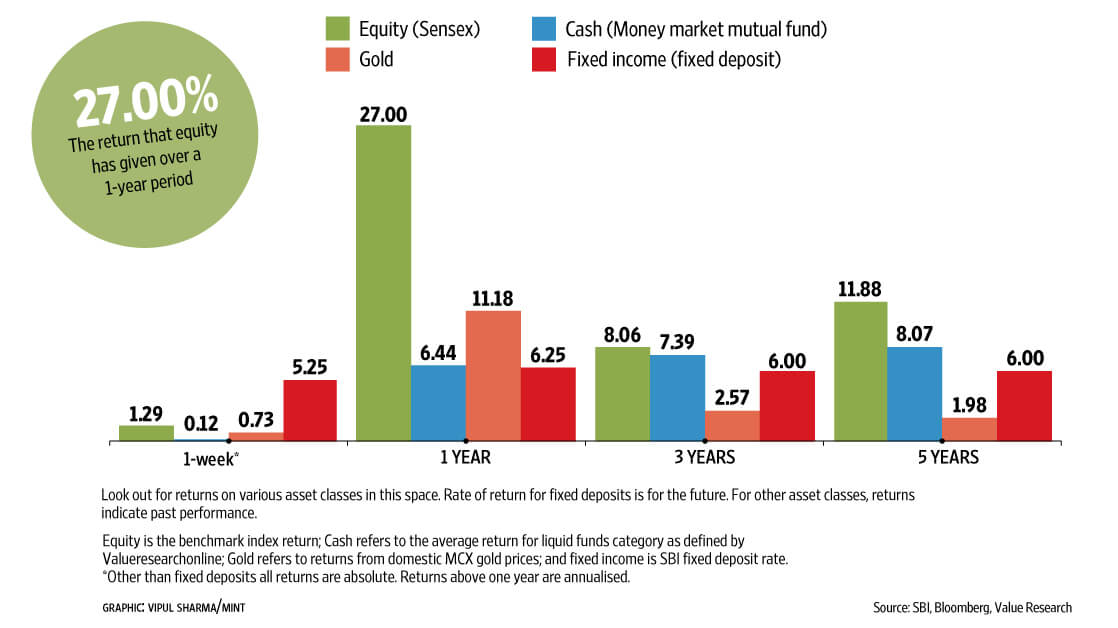
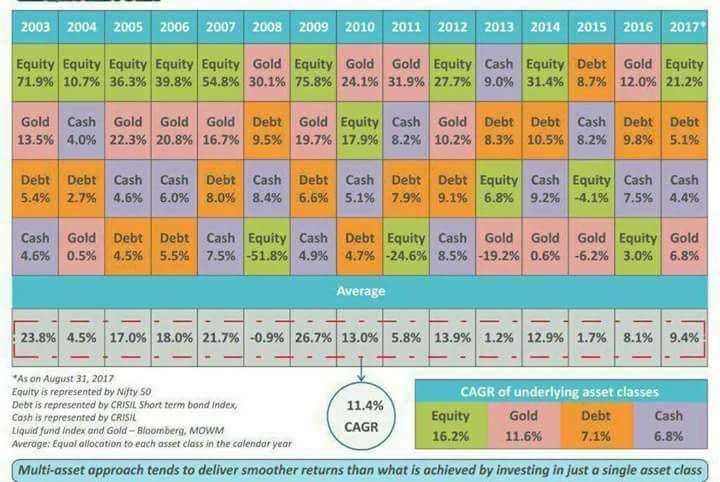
Various asset classes give different returns, which is why a portfolio must have an ideal mix on investments. Here are returns across four assets types (returns in %) over different time periods and each year from 2003.
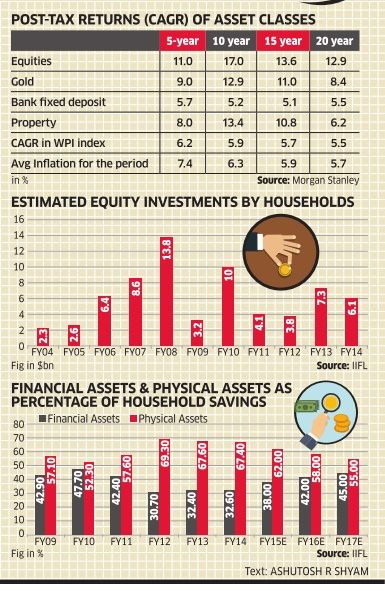
Returns of asset classes like Equities, Gold, Bank Fixed Deposit, Property as per Livemint ( Jan 2016).
Returns of asset classes like Equities, Gold, Bank Fixed Deposit, Property as per Economic Times ( Jan 2015)
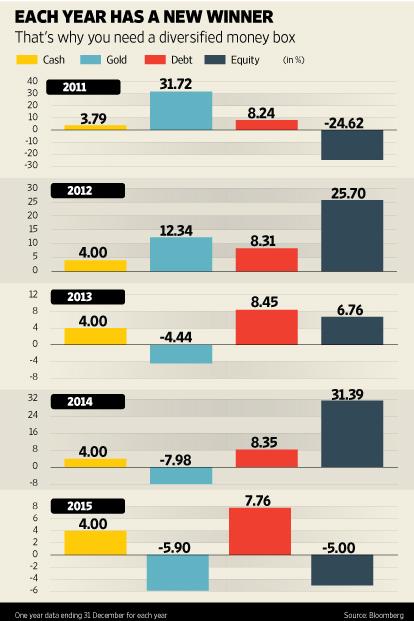
Yearly returns of Equity, Debt (Income Funds) and Gold (Ref : Livemint Feb 2013)

Returns on Gold,Equity,Real Estate across various periods
From Livemint’s Why you shouldn’t buy only equities even for the long term, Returns of equity, gold, fixed deposit from Jan 1983 to Dec 2012 in 4 year time period

Stock Market Returns
Stock market returns from 1 Dec 2007 to Dec 2012, annual returns, monthly returns are given below (Ref : Capital Mind The Nifty in 2014)
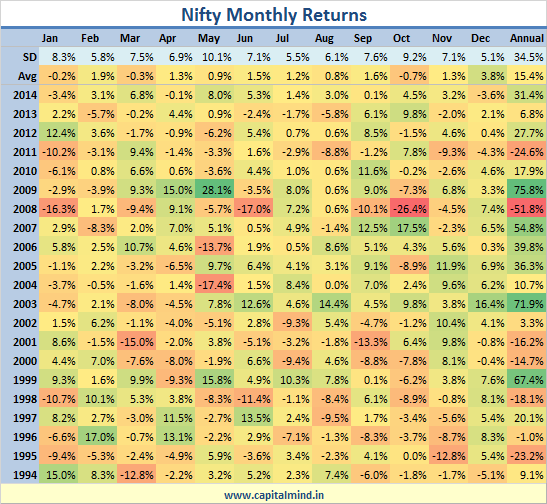
While the annual Nifty returns from 1992 are given in picture below

Monthly returns of Nifty are given in picture below
Real Estate Returns in India
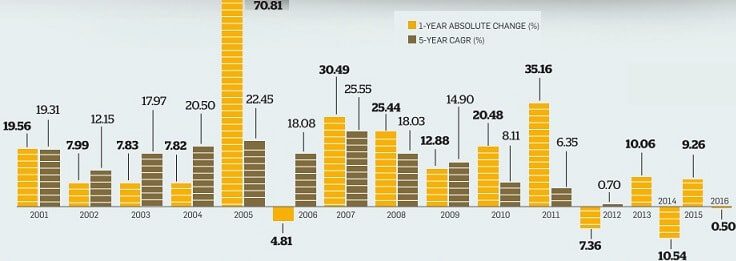
From Caporbit WHAT HAPPENS TO YOUR REAL ESTATE INVESTMENT IF PRICES CRASH? annual returns from real estate from 1991 to 2007 are given below.

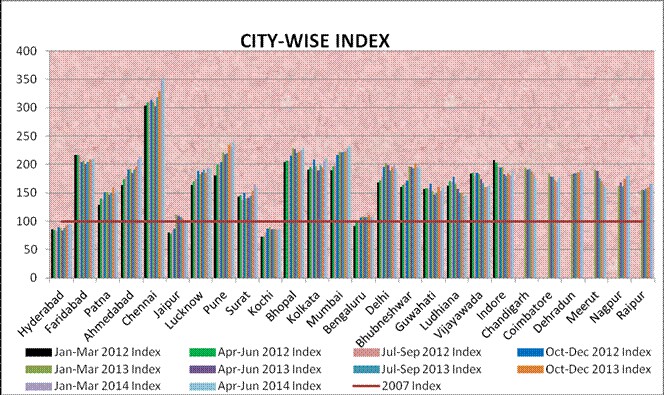
The National Housing Bank (NHB) which is owned by the Reserve Bank of India (RBI) launched the Residex which is a housing price index in 2007. It started with a few cities and is gradually expanding to cover Tier-I and Tier-II cities in India. NHB kept the base year as 2007 and started the index at a value of 100. The NHB also provides city specific indices. For example in Mumbai they have broken down the city into various zones and there are separate indices for each of them. For example, Zone 1 is Cuffe Parade, Malabar Hill and Zone 6 is Bhandup, Mulund. They also cover areas around Mumbai like Thane, Navi Mumbai and Virar.
In the chart below, 2007 is the base year and the index starts at 100. Residential real estate returns as per Residex data, 2007-2014 is given below:
Fixed Deposit Rates in India
Fixed Deposit rates from 1991-92 are given below , the rate came down from 12% in 1991-92 to 4% in 2003-04 before going upwards

Returns from Gold in India
Gold prices in India have been in mostly in up trend but has come down in recent years from Goldprice.org
Returns from Gold is shown in the image below
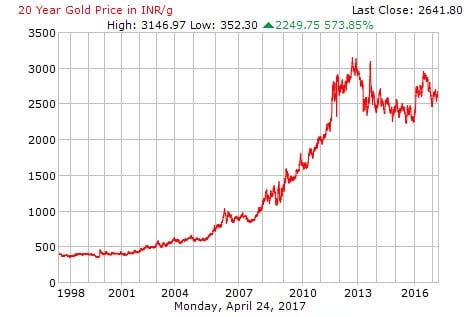
How gold prices have moved over last 5 years

Prices since 1970-71 you can read in our article Prices of Gold, Silver
Related Articles :
- Comparison of Fixed Deposits and Sensex Returns
- Ups and Downs of Sensex
- Prices of Gold, Silver
- Fixed Deposits and Tax
Just like balanced diet we need personal balanced financial plan with some allocation to Fixed Deposits,some to equities, some to real estate as per one age, risk profile and other factors called asset allocation. Numbers present one side of the story but what is important to understand is why it happened and use that to find out why it happened? Which asset class will do well going forward? What do you invest in Equities, Fixed Deposits, Gold, Real Estate? How do you decide which asset class to invest in ?


24 responses to “Returns of Stock Market, Gold, Real Estate,Fixed Deposit”
I found it intriguing that you had ever considered altering the layout of your website. I honestly enjoy what you’ve got to say; it’s extremely well-constructed. However, you might eventually add to the technique for the stuff so that people could understand it better.
Fixed deposits are a safe and secure way to save money. They offer high rates of interest which are usually higher than other savings products. Thanks for this detailed post on explaining the different investment returns.
In India 80% people still park their money in FDs,NSC,Bonds,various post office schemes or any other CONVENTIONAL Instruments which returns in the range of 7-8% & post TDS its effectively 5.5% in hand. With inflation rate higher(ground reality is close to 10%), so Conventional Instruments making them POORER by good 4.5% YoY.
Yes but slowly people are moving to invest in Equities either directly or through Mutual Funds
Thank you for sharing me useful information
http://www.fundmaker.in
thank you so much
It is Verry helpful information for me . now I can easily explain to my clients for there best returns investments.
If money is your hope for independence you will never have it. The only real security that a man will have in this world is a reserve of knowledge, experience, and ability. –Henry Ford
EXCELLENT DETAILED ANALYSIS NEVER SEEN BEFORE.
THANKS
Thanks for sharing great article. Great written.
Update every year compare
Very nice analysis. I never read such comparative article about stock market.
MANY MANY THANKS FOR PROVIDING THESE BEAUTIFUL DATA.
[…] Source: http://bemoneyaware.com […]
Descriptive one!!!!
Short but sweet
Hi
Nice article. Can you provide the source link for the visual comparing last 20 years returns from various assets that you have mentioned as sourced from Economictimes, Jan 2015? I mean the first visual in your article. Thanks.
I can access it through Archives of epaperbeta.timesofindia.com. Google search doesn’t help.
If you need help in that I would be happy to share.
Another article which might be of interest is Asset Returns in India (1991–2013) (pdf) . Hope it helps.(I have not verified the data)
please send above information my email id
Brilliantly written!
Ram thanks for making our efforts worth it.
fantastic..appreciate the effort put through
Fantastic..appreciate the effort you took to write comment and encourage us
Wonderful post kirti..!
One of the detailed post on Stock Market Returns Comparison, I have ever read.!
Thanks Mihir for appreciation.