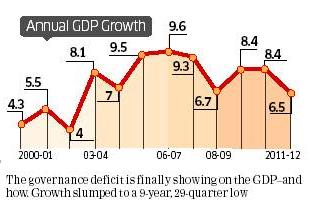
For the financial year 2012, GDP grew at 6.5 percent against 8.5 percent last fiscal. On 31th May 2012 when GDP numbers were declared,TV channels, newspapers,twitter were full of comments, analysis on GPP numbers. This happens every quarter! Summary of discussion was :
India’s economic growth has plunged to its lowest in nine years during the January-March quarter, deepening the gloom and pessimism that has gripped much of Indian business. It highlighted what many economists and industrialists characterise as the inept handling of the economy by the Manmohan Singh-led government, which has sent investor confidence plummeting.
This led us to find out more on what is GDP number? Why is it significant? What does it mean? This article tries to answers those question.
Table of Contents
What is GDP?
GDP, or Gross Domestic Product, is the value of all goods and services produced in the economy over a period of time, normally a year. GDP is considered to be yardstick of measuring the functioning of the economy. GDP is a measure of production. The level of production is important because it largely determines how much a country can afford to consume and it also affects the level of employment. The GDP is a benchmark that measures the expansion and contraction of the national economy. Bankers, investment brokers, and government officials use the GDP to determine such things as interest rates, investment opportunities, and tax rates. Trading economies has data on GDP of countries for example US, China, India, Brazil
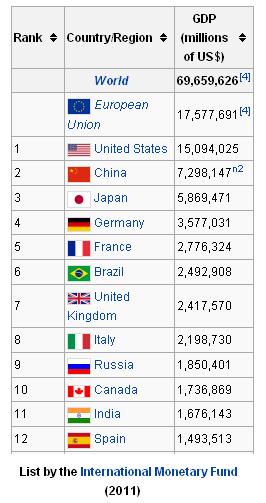
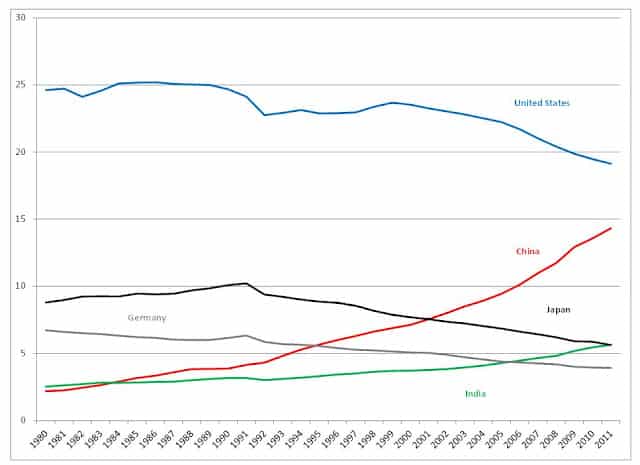
GDP of various countries is shown in figures below. First figure shows GDP of countries in 2011 as IMF (Source Wiki), while second figure shows GDP of some countries over the years.
GDP is usually expressed as a comparison to the previous GDP value in percentage. That is called GDP Growth Rate. Usually yearly or quarterly GDP growth rates are used. For example 3% GDP growth rates in 2011 means the economy grows by 3% as compared to 2010. On the other hand, –3% GDP growth rates means the economy declines by 3%GDP is usually expressed as a comparison to the previous GDP value in percentage.
|
|
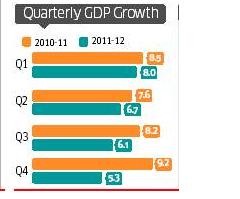
As you can see from the Annual GDP growth of India how GDP reflects the Indian story of bloom and doom. Quarterly GDP growth shows that For the year 2011-12 GDP growth has slowed down from 8.0 in first quarter Q1 of 2011-12 through 6.7 in Q2 , 6.1 in Q1 and 5.3 in Q4 of 2011-12. It also shows comparison with corresponding quarter of 2010-11 ex: 5.3 in Q4 of 2011-12 vs 9.2 in Q4 of 2010-11
In India GDP is calculated by Central Statistical Office (CSO) which is part of Ministry of Statistics and Programme Implementation. In USA GDP is calculated by the Bureau of Economic Analysis (BEA). Every agency first releases the quarterly estimates which are later revised to show the final numbers.
Importance of GDP
GDP is important for three reasons:
- It is used to determine if the country’s economy is growing more quickly or more slowly than the year before or quarter before, or the same quarter the year before as shown in figures below
- GDP is also used to compare the size of economies throughout the world.
- It is to compare the relative growth rate of economies throughout the world.
The Central Banks such as RBI uses the GDP growth rate to decide whether to implement expansionary monetary policy to ward off recession or contractionary monetary policy to prevent inflation.
Investors look at the GDP growth rate to see if the economy is changing rapidly so they can adjust their asset allocation. In addition, investors compare country GDP growth rates to decide where the best opportunities are. Most investors like to purchase shares of companies that are in rapidly growing companies.
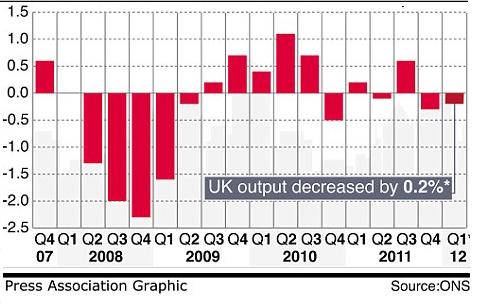
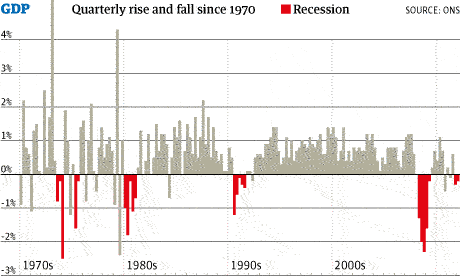
GDP growth rate is often as a recession detector. When GDP growth rate is negative for 2 or more consecutive quarters, economist calls that as “Recession”.When recession happens people withdraw their investments mostly in equities leading to stock market going down. For example in United Kingdom or UK, GDP shrank by 0.2% in Quarter Jan-Mar of 2011-12, following a 0.3% contraction in the last quarter. Hence it was declared that Britain has sunk into recession. These days we also hear about Double-dip recession which is a situation where the economy begins to recover from a recession, then plunges right back in. Britain went through a recession in 2008 and now again so it is suffering from double dip recession. Figure below show the quarterly GDP figures of UK since 2007-08 and Quarterly GDP in UK since 1970 highlighting recessions. Article HowStuffWorks:How Recessions Work explains recession in detail.
Ref: DailyMail:UK recession, Guardian:UK Recession, Wiki:Recession Shapes
Using GDP Data
Let’s say the GDP growth rate is speeding up, and the RBI raises interest rates to stem inflation. In this case, you would want to lock in a fixed-rate for home loans, because you know that an floating rate will start charging higher rates next year.
Declining GDP means business revenues are down, which usually leads to layoffs and unemployment( it can take several months). If GDP is slowing down, or is negative, then you should dust off your resume. If you follow GDP statistics, you can be better prepared.
You could also use the GDP report to look at which sectors of the economy are growing and which are declining. This would help you determine whether you should invest in, say, a tech-specific mutual fund vs a fund that focuses on agribusiness. It can also help you find training in sectors that are growing. Even during the 2008 financial crisis, health care related industries continued to add jobs.
For example as GDP currently has slowed down the effect on various group of people is shown below (Ref:Hindustan Times)
How is GDP Calculated?
GDP can be calculated in many ways such as income approach, production approach, expenditure approach. In India the two ways used are Production and Expenditure Approach.
Production Approach: It breaks down the economy into different sectors such as agriculture, forestry, fishing, mining, manufacturing, electricity etc and then computes the value that has been added in each sector. A key indicator or a set of key indicators for which data in volume or quantity terms is available on quarterly basis, are used to extrapolate the value of output/value added estimates of the previous year. For example, in the case of agriculture sector, the set of key indicators are the quarterly estimates of agriculture production (at individual crop level) and in the case of manufacturing sector, the key indicators are the index of industrial production (at 2-digit industry group level) It shows which sectors of the economy are growing, and which are lagging.
Income Approach GDP : is calculated by adding up what everyone earned in a year i.e the incomes generated within the domestic economy. The income approach, which is sometimes referred to as GDP(I), is calculated by adding up total compensation to employees, gross profits for incorporated and non incorporated firms, and taxes less any subsidies.
Expenditure Approach: is calculated by adding what everyone has spent. A common equation for GDP calculation is:
GDP = Consumption + Investment + Exports – Imports.
Economists (since Keynes) have preferred to split the general consumption term into two parts: private consumption and public sector spending. Therefore, the standard GDP formula is expressed as
GDP = Private or Consumer Consumption(C) + Government(G) + Investment (I)+ Net Exports(NX)
- C is private consumption or consumer expenditure which is expenditure incurred by Indians on consuming goods and services
- G is government expenditure: money spent by the government on its activities.
- I is business investments or Gross Capital Formation
- NX is gross exports – gross imports.
To know about GDP figures of India one can read MOSPI:Overview of GDP and Press Release:Estimates of Gross Domestic Product for the Fourth Quarter (January-March) of 2011-12
Real GDP and Nominal GDP
As we know now GDP is the value of all the goods and services produced in a country. But value of good and services changes over period of time due to Inflation. Hence it becomes difficult to compare GDP over period of time. Say Let’s take simplistic economy which only produces apples and pears.
The price for an apple is $2 in 2000, whereas the price for a pear is $3. Same year we produce 100 apples and 50 pears. In 2005, because of the inflation the price for an apple goes up to $3, whereas the price for a pear is $4 at the same production levels.
- GDP in 2000 is $200(2X100) + $150(3X50)= $350
- GDP in 2005 is $300(3X100) + $200(4X50) = $500
Has economy done well in 2005 compared to 2000?
Another example. Suppose in the year 2010, the economy of a country produced 100 billion worth of goods and services based on year 2011 prices say in dollars. In the year 2010, the economy produced $110B worth of goods and services based on year 2011 prices. Has the economy done well in 2011 compared to 2010 as 2011 prices are more than 2010 due to inflation?
To account for inflation two GDP figures are released one based on current prices called as Nominal GDP and other one based on base-year prices called as Real GDP.
So using the above example the GDP figures for the year 2011 are valued at $105B if year 2000 prices are used. Hence now we can compare
| Year | Nominal GDP | Real GDP |
| 2010 | $100 Billion | $100 Billion |
| 2011 | $110 Billion | $105 Billion |
Hence now : Nominal GDP Growth Rate = 10% Real GDP Growth Rate = 5%
The difference between Nominal GDP and Real GDP is used to measure inflation in a statistic called The GDP Deflator. GDP deflator is a price index that measures the gross domestic product by adjusting the impact of changes in prices of goods and services to the true value of goods and services produced locally in the economy. As the name suggests, it serves a specific purpose of giving the real GDP from the nominal GDP by deflating the price effect. For example, a price deflator of 50 means that the current year price is half the base-year price — price deflation. India uses a combination of Wholesale Price Index ( WPI) and Consumer Price Index (WPI) as deflator on a quarterly basis with a time lag of two months. ET In Classroom:GDP deflator explains the concept.
Other Indicators
GDP is just one of the indicators of the economy. There are other indicators like
- Index of Industrial Production or IIP is an abstract number, the magnitude of which represents the status of production in the industrial sector for a given period of time as compared to a reference period of time It is a statistical device which enables us to arrive at a single representative figure to measure the general level of industrial activity in the economy.
- Wholesale Price Index (WPI) The prices of goods, which are dealt with, wholesale, mainly bulk goods, which are mostly inputs to production rather than finished commodities. A wholesale price index, for example, includes wheat and sheet steel, where a retail price index includes bread and cars. Because they involve goods that are dealt in before the production of final goods, and are held as stocks of inputs, wholesale price indexes tend to be leading indicators, moving earlier in trade cycles than the retail or consumer price index.
- Foreign Direct Investment or FDI refers to an investment made to acquire lasting interest in enterprises operating outside of the economy of the investor.
- HSBC Purchasing Managers’ Index or PMI Index are are long-established monthly data-driven snapshots of individual countries’ economies which accurately measure economic activity and report well before other comparative official and government statistics. HSBC:PMI
Onemint:Important Indian Economic Numbers and their Release Date gives an idea of these numbers.
In this article we have tried to explain about GDP in simple terms with examples covering topics like what is GDP number? Why is it significant? What does it mean? What are Real and Nominal GDP ? What is GDP deflator? How can one use GDP data? We look forward to hearing from you!


3 responses to “Understanding Gross Domestic Product or GDP”
[…] Understanding Gross Domestic Product or GDP […]
Another excellent article written in a lucid way gleaning from different sources…
The article succeeds in explaining complex economic terms to a ordinary guy..Keep up the good work
Thanks a lot for your encouraging words. I try to make it simple as I am not from financial background and jargons scare me.