How to find out If the country doing well financially? There are some terms like GDP, GNP, Per Capita GDP used. We shall look at what are the Economic Indicators? What is GDP in detail?
Table of Contents
Economic Indicators
An indicator is a number or sign or signal that tells you something. A society’s economic level and activity can be measured by using various indicators. Economic Indicators are numbers that you can look at to try to get a picture of how well the economy is doing. Economic reports and indicators are those often-voluminous statistics put out by government agencies, non-profit organizations and even private companies. They provide measurements for evaluating the health of our economy, the latest business cycles and how consumers are spending and generally faring. Various economic indicators are released daily, weekly, monthly and/or quarterly.
Gross Domestic Product, or GDP, is the measure of how many finished goods and services were produced in a country over the course of a year. GDP is probably the most important measure of the size and performance of an economy, but it’s not the only one.
GNP stands or Gross national product. The difference is that GNP is the value of all the products and services produced by a country’s residents, even if production takes place outside of the country.
Per Capita GDP (which means economic value per person): Comparing GDP with the population to come up with
So for example, according to the World Bank, in 2013, China’s GDP was a massive $9.2 trillion. Compare that to Luxembourg’s relatively small GDP of $60 billion. Yet in the same year, China’s GDP Per Capita was only about $6,800, while Luxembourg’s was more than 16 times that, at about $110,000. So while China’s economy is certainly much larger, it looks like each individual citizen, on average, is better off in Luxembourg.
PPP or Purchasing power parity is used worldwide to compare the income levels in different countries. It states that once the difference in exchange rates is accounted for, then everything would cost the same. Example: Let’s say that a pair of shoes costs Rs 2400 in India. Then it should cost $40 in America when the exchange rate is 60 between the dollar and the rupee. That’s not true in the real world are there are differences in transportation costs, taxes, and tariffs.
By analyzing this data, we can describe a nation as 1. underdeveloped 2. developing 3. developed.
Developed: high literacy rate, life expectancy, strong infrastructure, high GDP
Under-developed: fewest jobs, fewest services, lowest literacy rate, little infrastructure, & shortest life expectancy
Developing: few jobs, limited services, low literacy rate, little infrastructure, & short life expectancy.
What is GDP?
GDP stands for Gross Domestic Product. GDP is a common measure that’s used to roughly represent the size of a country’s economy. Gross Domestic Product, or GDP, is the measure of how many finished goods and services were produced in a country over the course of a year. Tt only measures finished products, this means that goods that are produced to be added to a different product later are not counted. An example of this is raw steel that is later used to build a car is not counted as part of GDP, but the car itself is. This is the biggest estimator of how the economy as a whole is doing.
Who measures GDP?
In the USA, The U.S. Department of Commerce’s Bureau of Economic Analysis releases the data quarterly, including any revisions, within the last week to 10 days of each month following the end of the quarter. Data is called as “advance estimates,” “preliminary estimates,” and “final” numbers. Each data release includes an explanation of why the GDP increased or decreased from the previous quarter. You can find it at www.bea.gov
In India: GDP in India is calculated by Central Statistics Office (CSO, Ministry of Statistics and Programme Implementation). http://mospi.nic.in/
YouTube Video on GDP
GDP in India
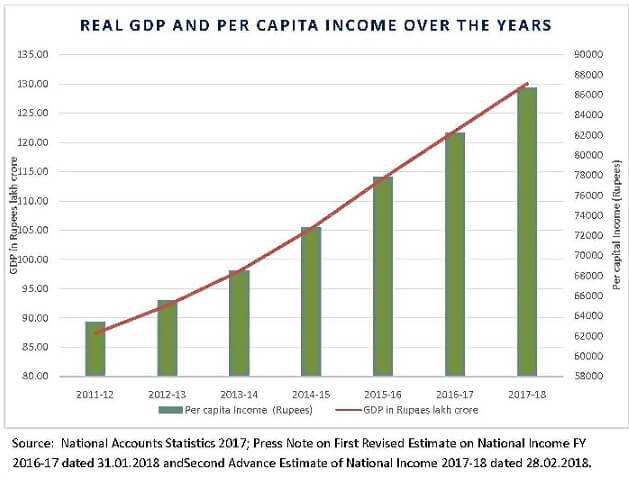
The economy of India is a developing mixed economy. It is the world’s 7th largest economy by nominal GDP and the 3rd largest by purchasing power parity (PPP). The country ranks 139th in per capita GDP (nominal) with $2,134 and 122nd in per capita GDP (PPP) with $7,783 as of 2018. After 1991 economic liberalisation, India achieved 6-7% average GDP growth annually. In FY 2015 and 2018, India’s economy became the world’s fastest-growing major economy, surpassing China.
The long-term growth prospects of the Indian economy is positive due to its young population, corresponding low dependency ratio, healthy savings and investment rates, and increasing integration into the global economy

GDP growth of India
Top 10 Countries as per GDP
The United States is the world’s largest economy with a GDP of approximately $18.56 trillion The United States has been the world’s biggest economy since 1871. But that top ranking is now under threat from China.
|   | World | 79,865,481 |
| 1 | 20,412,870 | |
| — | 19,669,743 | |
| 2 | 14,092,514 | |
| 3 | 5,167,051 | |
| 4 | 4,211,635 | |
| 5 | 2,936,286 | |
| 6 | 2,925,096 | |
| 7 | 2,848,231 | |
| 8 | 2,181,970 | |
| 9 | 2,138,918 | |
| 10 | 1,798,512 | |
| 11 | 1,719,000 |
Related Articles:
- What is IMF? How does it work? Difference from World Bank
- UN, IMF, World Bank: Rich and Poor countries of World, MUN
- What is Inflation? How is it Calculated? WPI, CPI in India,HyperInflation
- What is GDP, Gross Domestic Product
- What are Central Banks,What is RBI? What do they do?
- G20: Where World Leaders meet


interesting informative post thanks to sharing