Just like Sensex and Nifty tracks the stock prices, index for tracking price movements in residential properties India is NHB RESIDEX or simply RESIDEX. NHB Residex is India’s first official housing price index by the National Housing Bank(NHB), the regulator of housing finance in India. Website for NHB Residex is www.nhb.org.in
What information does the NHB Residex show?
The NHB Residex tracks residential rates of properties across 26 cities (as per Jul-Sep 2013 update) and for each city there are details of individual municipal areas or zones. The base of the Residex is taken as 100 points. Any movement in the price band in a particular area is denoted by an increase or decrease as shown for three cities below.
| CITIES | 2007 Index | Apr-Jun 2011 Index | Jul-Sept 2011 Index | Oct-Dec 2011 Index | Jan-Mar 2012 Index | Apr-Jun 2012 Index | Jul-Sep 2012 Index | Oct-Dec 2012 Index | Jan- Mar 2013 Index | Apr-Jun 2013 Index | Jul-Sep 2013 Index |
| Hyderabad |
100 |
91 |
84 |
79 |
86 |
85 |
84 |
90 |
88 |
84 |
88 |
| Bengaluru |
100 |
92 |
93 |
100 |
92 |
100 |
98 |
106 |
109 |
108 |
107 |
| Delhi |
100 |
147 |
154 |
167 |
168 |
172 |
178 |
195 |
202 |
199 |
190 |
For example, Delhi started with an average base point of 100 in 2007. In Jan-Mar 2013 the index was 202, In Apr-Jun 2013 index came down to 199 indicating that there was an downward price movement. Between Jul-Sep 2013, prices moved down further and the Residex touched 190 points.
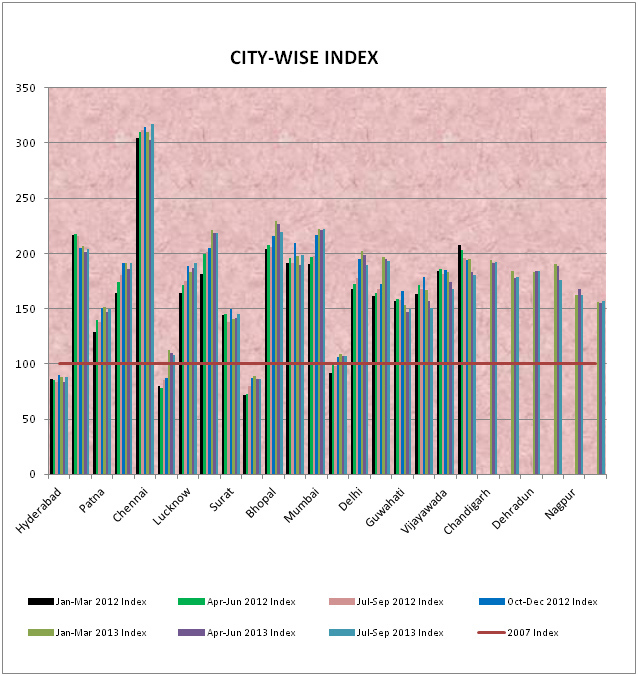
This information is also represented as chart as shown in image below (Click on image to enlarge):

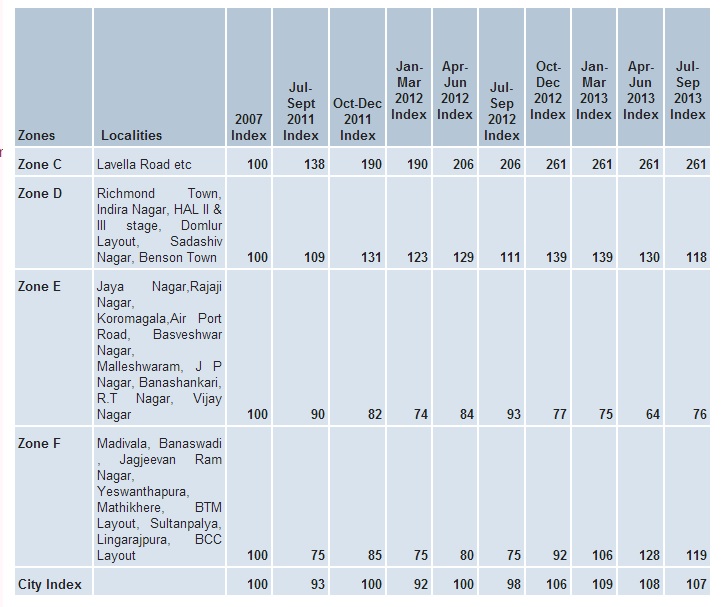
Within a city there are details of individual municipal areas or zones as shown for Bangalore in image below (Click on image to enlarge)

How does NHB gets its data?
NHB collects data from various sources, such as banks and independent dealers in the region. Primary data on housing prices is collected from real estate agents by commissioning the services of private consultancy/research organisatons of national repute; in addition data on housing prices is also collected from the housing finance companies and bank, which is based on housing loans contracted by these institutions.
Unlike developed markets like Europe where there are set standards and valuations conform to the International Valuation Standards Committee and RICS norms, property valuations in India are done by diverse groups of professionals with varying backgrounds and skills. This brings certain deviation in their reading.
The index is constructed using the weighted average methodology with Price Relative Method (Modified Laspeyre’s approach).
How often in the NHB Residex updated?
NHB Residex is updated quarterly (half-yearly till 2009) but published after a lime lag of 3-4 months. Well It’s not timely but you can assess and understand the price trends prevailing in residential property market.
How many cities does the NHB cover?
It covers 26 cities (as per Jul-Sep 2013 update) but the proposal is to expand NHB RESIDEX to 63 cities which are covered under the Jawahar Lal Nehru National Urban Renewal Mission to make it a truly national index.
Since how long is the NHB Residex published?
- Pilot study covered 5 cities viz. Delhi, Mumbai, Kolkata, Bangalore and Bhopal and 2001 was taken as the base year for the study to be comparable with the WPI and CPI. Year to year price movement during the period 2001-2005 has been captured in the study, and subsequently updated for two more years i.e. up to 2007.
- The base year was then shifted from 2001 to 2007 and NHB RESIDEX was expanded to cover ten more cities, viz, Ahmedabad, Faridabad, Chennai, Kochi, Hyderabad, Jaipur, Patna, Lucknow, Pune and Surat.
- From quarter January-March, 2012, NHB RESIDEX has been further expanded to cover 5 more cities viz Bhubneshwar, Guwahati, Ludhiana, Vijayawada & Indore.
- From April-June, 2012 onwards the Index of Delhi was expanded to cover Gurgaon, Noida, Greater Noida and Ghaziabad i.e National Capital Region (NCR)
- NHB RESIDEX has been expanded to include six new cities namely Chandigarh, Coimbatore, Dehradun, Meerut, Nagpur and Raipur from the quarter January-March, 2013 thereby taking the total of number of cities covered to 26.
More details at About NHB Residex
How does Residex help ?
NHB Residex helps the general consumers and property buyers and borrowers in their decision-making by enabling comparisons over time and across cities and localities and the emerging trends.The Residex has been constructed for many cities and has taken into account the price trends for residential properties in different locations and zones in each city as per classification devised for the purpose. The classification has been designed so as to give the most representative Index for each city based on the transactions in the market and data collected from various sources. The data are put through a Model that depicts the actual behaviour of the market and throws up the Index. This initiative seeks to provide a better understanding of the trends in the Residential property market and its various nuances. The trends also seek to bring greater transparency in the property market. As the Residex evolves, it is expected to bring greater uniformity and standardisation in the valuation of properties across the industry.
Is there any other index to track property?
MagicBricks PropIndex MagicBricks PropIndex is a tool which empowers property seekers and investors with detailed information on the movement of residential apartment prices and supply of properties in India. More details at Prop Index Report
The IIMB MB HSI (IIMB, and Magic Bricks) Housing Sentiment Index, is a sentiment index of the Indian real estate market that aims to capture buyer mood and serve as a leading indicator of residential real estate market performance. The first inaugural report has now been released by comparing survey results in the month of September 2013 against Index scores captured earlier in July 2013.
The HSI currently covers the 8 cities of Mumbai, Delhi, Hyderabad, Pune, Noida, Gurgaon, Bangalore & Chennai. An HSI of 100 suggests that buyers expect prices to remain at current levels, while values lower than 100 suggest that buyers expect prices to fall and higher than 100 that they expect them to rise. Ref : Magicbricks& IIM-B release India’s first “Housing Sentiment Index” and HSI Report
NHB Residex for QUARTER JULY-SEPTEMBER 2013
CITY WISE HOUSING PRICE INDEX (UPDATING UPTO QUARTER JULY-SEPTEMBER 2013)
| CITIES | 2007 Index | Apr-Jun 2011 Index | Jul-Sept 2011 Index | Oct-Dec 2011 Index | Jan-Mar 2012 Index | Apr-Jun 2012 Index | Jul-Sep 2012 Index | Oct-Dec 2012 Index | Jan- Mar 2013 Index | Apr-Jun 2013 Index | Jul-Sep 2013 Index |
| Hyderabad |
100 |
91 |
84 |
79 |
86 |
85 |
84 |
90 |
88 |
84 |
88 |
| Faridabad |
100 |
220 |
206 |
218 |
217 |
217 |
216 |
205 |
207 |
202 |
204 |
| Patna |
100 |
146 |
141 |
140 |
129 |
140 |
138 |
151 |
152 |
147 |
150 |
| Ahmedabad |
100 |
169 |
163 |
167 |
164 |
174 |
180 |
191 |
192 |
186 |
191 |
| Chennai |
100 |
248 |
271 |
296 |
304 |
309 |
312 |
314 |
310 |
303 |
318 |
| Jaipur |
100 |
64 |
65 |
64 |
80 |
78 |
85 |
87 |
112 |
110 |
108 |
| Lucknow |
100 |
160 |
154 |
165 |
164 |
171 |
175 |
189 |
183 |
187 |
191 |
| Pune |
100 |
150 |
169 |
184 |
181 |
200 |
201 |
205 |
221 |
219 |
219 |
| Surat |
100 |
149 |
139 |
152 |
144 |
145 |
138 |
150 |
140 |
142 |
145 |
| Kochi |
100 |
107 |
97 |
82 |
72 |
73 |
80 |
87 |
89 |
86 |
86 |
| Bhopal |
100 |
224 |
208 |
211 |
204 |
207 |
206 |
216 |
230 |
227 |
220 |
| Kolkata |
100 |
194 |
191 |
190 |
191 |
196 |
191 |
209 |
197 |
189 |
199 |
| Mumbai |
100 |
181 |
194 |
193 |
190 |
197 |
198 |
217 |
222 |
221 |
222 |
| Bengaluru |
100 |
92 |
93 |
100 |
92 |
100 |
98 |
106 |
109 |
108 |
107 |
| Delhi |
100 |
147 |
154 |
167 |
168 |
172 |
178 |
195 |
202 |
199 |
190 |
| Bhubneshwar |
100 |
161 |
164 |
168 |
172 |
197 |
195 |
193 |
|||
| Guwahati |
100 |
157 |
159 |
158 |
166 |
153 |
147 |
149 |
|||
| Ludhiana |
100 |
163 |
171 |
168 |
179 |
167 |
157 |
150 |
|||
| Vijayawada |
100 |
184 |
186 |
181 |
185 |
184 |
174 |
167 |
|||
| Indore |
100 |
208 |
203 |
196 |
194 |
195 |
184 |
180 |
|||
| Chandigarh |
100 |
194 |
191 |
192 |
|||||||
| Coimbatore |
100 |
184 |
178 |
178 |
|||||||
| Dehradun |
100 |
183 |
184 |
184 |
|||||||
| Meerut |
100 |
191 |
189 |
176 |
|||||||
| Nagpur |
100 |
163 |
168 |
162 |
|||||||
| Raipur |
100 |
156 |
155 |
15 |
Related Articles :
- Stock exchange : What is it, Who owns, controls it
- Stock Market Index: The Basics
- On Selling a house
- Capital Loss on Sale of House
- Cost Inflation Index from Financial Year 1981-82 to Financial Year 2011-12
Till the time standard valuation norms come into play, homebuyers can depend on the small database of the NHB and banks’ valuation as a rough indication. But do your due diligence before investing. Do you think such indices would be of help? Do you track residential property prices? If yes how? How did you choose your residence?

6 responses to “Index for Real Estate : NHB Residex”
Global Housing has been thoughtfilly planned with integrated functionally and luxurious inexperienced surroundings. every housing offered by the project is splendidly designed keeping in mind the wants of its residents.visit: http://globalheightsohna.com/
Very informative article..Pune city is also becoming best place for the investment. if anybody looking for investment then visit Life Republic project by Kolte patil. This project is located at Hinjewadi, Pune anf offering 2/3 bhk flats at affordable rates.
Anyone looking for a flats in Pune just visit Flats at pune
Thanks for your great effort to share this information. anyone looking for flats in Thane then walk through Ready flats
Right Property is a Real estate website where you can find, Property for Sale in Coimbatore, Property for Rent in Coimbatore. You can buy or sell or rent any property and engage with lands in Coimbatore and Pollachi.
to see more:http://rightproperty.in/
Thanks for the information you have provided. In present days, the demand for real estate properties has increased in Hyderabad and it is the best place for the investors to invest in real estate.
Property Dealers in Hyderabad