In Understanding Gross Domestic Product or GDP we what is GDP? What does it mean?Why is it significant? Difference between Real and Nominal GDP etc. In this article we shall look at the GDP numbers of India and learn about. Who releases the GDP data? What numbers are released? How it is calculated? Interpreting the GDP numbers.
Table of Contents
Overview of GDP
GDP, or Gross Domestic Product, is the value of all goods and services produced in the economy over a period of time, normally a year. GDP is considered to be yardstick of measuring the functioning of the economy. GDP is usually expressed as a comparison to the previous GDP value in percentage. That is calledGDP Growth Rate. Usually yearly or quarterly GDP growth rates are used. To account for inflation two GDP figures are released one based on current prices called as Nominal GDP and other one based on base-year prices called as Real GDP. GDP can be calculated in many ways such as income approach, production approach, expenditure approach.
Who releases GDP numbers?
In India GDP is calculated by Central Statistical Office (CSO) which is part of Ministry of Statistics and Programme Implementation. CSO introduced the quarterly estimates of GDP in 1999 as part of the requirements under the Special Data Dissemination Standard of the IMF. In India, the quarterly GDP releases with a delay of approximately two months with respect to the end of the reference period. For Instance- the data for Fourth Quarter(Jan-Mar) 2011-12 were published on 31st May 2012. MOSPI releases the Advance Release Calendar which is updated on 1st of every month. The Advanced Release Calendar for Year 2012-13 is shown below.
Central Statistical Office or CSO, a part of part of Ministry of Statistics and Programme Implementation,is responsible for coordination of statistical activities in India, and evolving and maintaining statistical standards. Its activities include compilation of National Accounts; conduct of Annual Survey of Industries and Economic Censuses, compilation of Index of Industrial Production, as well as Consumer Price Indices. It also deals with various social statistics, training, international cooperation, Industrial Classification etc.
Understanding GDP figures of India
Market Prices and Base Year Prices
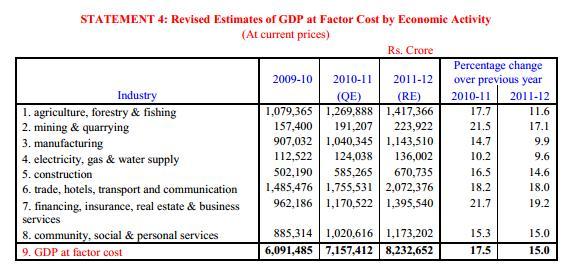
Every time any GDP number is released, 2 different numbers for GDP are released, one for the base year prices which currently is 2004-05(Real GDP) , which are inflation adjusted prices and one for the current prices (Nominal GDP) or market price. Base Year keeps on changing. Change of base year from 1999-2000 to 2004-05 happened in n 29.1.2010 The reason for periodically changing the base year is to take into account the structural changes which have been take place in the economy and to depict a true picture of the economy through macro aggregates like GDP, consumption expenditure, capital formation etc. MOSPI:Brochure on the New Series of National Accounts, Base Year 2004-05 explains the change of base year to 2004-05.
Production and Expenditure Approach
As we know GDP can be calculated in many ways such as income approach, production approach, expenditure approach. In India the two ways used are Production and Expenditure Approach. Ref:Onemint:How GDP is calculated (Dec 2011)
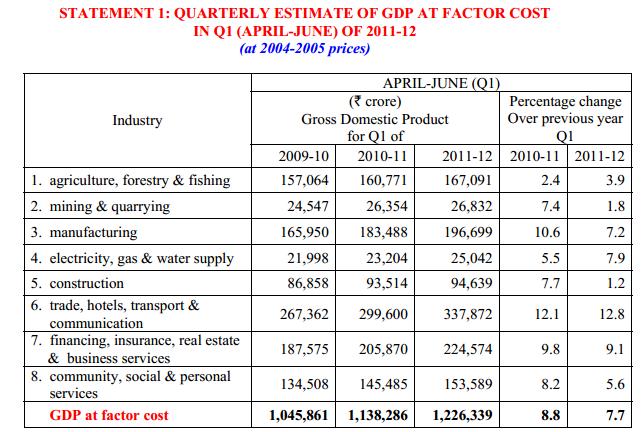
- Production Approach: It breaks down the economy into different sectors such as agriculture, forestry, fishing, mining, manufacturing, electricity etc and then computes the value that has been added in each sector. This is reported as ESTIMATES OF GDP BY ECONOMIC ACTIVITY
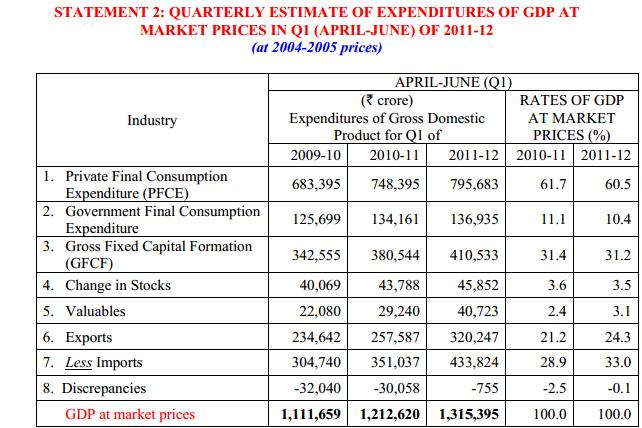
- Expenditure Approach: is calculated by adding what everyone has spent. A common equation for GDP calculation is:
GDP = Private or Consumer Consumption(C) + Government(G) + Investment (I)+ Net Exports(NX)
This is reported as ESTIMATES OF EXPENDITURES ON GDP
Quarterly, Cumulative Data
Along with the Data for each quarter the data is also reported for
- Quarterly data of previous quarters of the same year: say if report if for Q3 or third Quarter Oct-Dec 2011-12, GDP numbers for Q1 (Apr-Jun), Q2 (Jun-Sep) of 2011-12 are also reported, as shown in the first figure GDP calculation using production approach given below.
- Quarterly data of previous quarters of the two earlier years: say if report if for Q3 or third Quarter Oct-Dec 2011-12, GDP numbers for Q1 (Apr-Jun), Q2 (Jun-Sep) of 2009-10, 2010-11 are also reported, as shown in the first figure GDP calculation using production approach given below.
- Cumulative data of earlier quarters for this year: say if report if for Q4 or fourth Quarter Jan-Mar 2011-12, GDP numbers for entire year are reported as in figure 3 GDP using production approach showing annual(cumulative) data. Q2 report will have half-yearly data from Apr-Sep, Q3 report will have data from Apr-Dec.
- Cumulative data of earlier quarters for previous year: say if report if for Q4 or fourth Quarter Jan-Mar 2011-12, GDP numbers for year 2009-10, 2010-11 are also reported as in figure 3 GDP using production approach showing annual(cumulative) data
First Quarter (Apr-June) OF 2011-12, Second Quarter(Jul-Sep ) of 2011-12, Third Quarter (Oct-Dec) 2012, Fourth Quarter (Jan-Mar) 2011-12

- GDP calculation using production approach
Interpreting GDP numbers
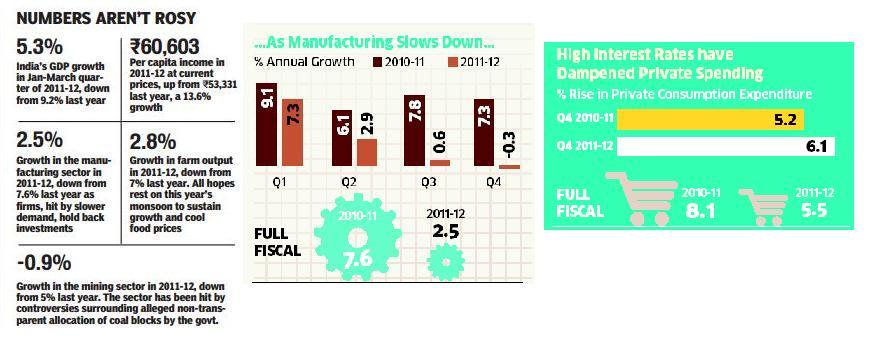
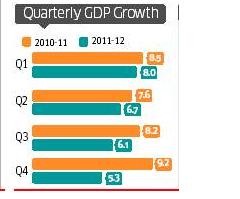
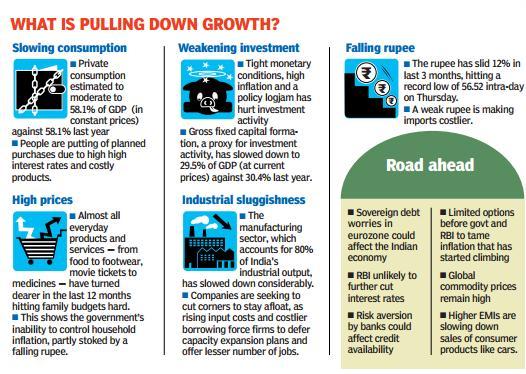
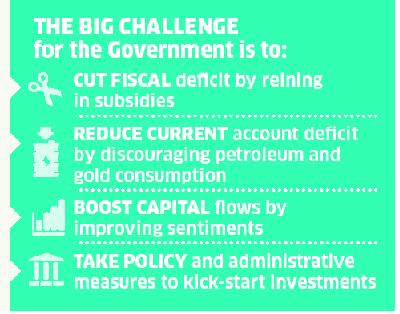
The information per-se is not in numbers but what story these numbers tell. NDTV: 10 things that numbers say (Jun 2012), Economic Times:Has GDP growth rate bottomed out?(Jun 2012) Hindustan Times:Anatomy of Slow Down (Jun 2012) details out the interpretations. The interpretation includes:
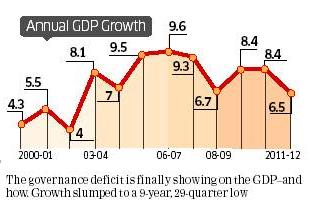
Understanding the quarterly numbers and the trends as shown in figure below:
Comparing GDP numbers with earlier numbers and finding out the trend
 |
Understanding the what is happening to economy and why
Looking for solutions
These images are from the HindustanTimes: Anatomy of SlowDown (pdf Jun 2012) and Economic Times (Jun 2012)
Understanding the living conditions
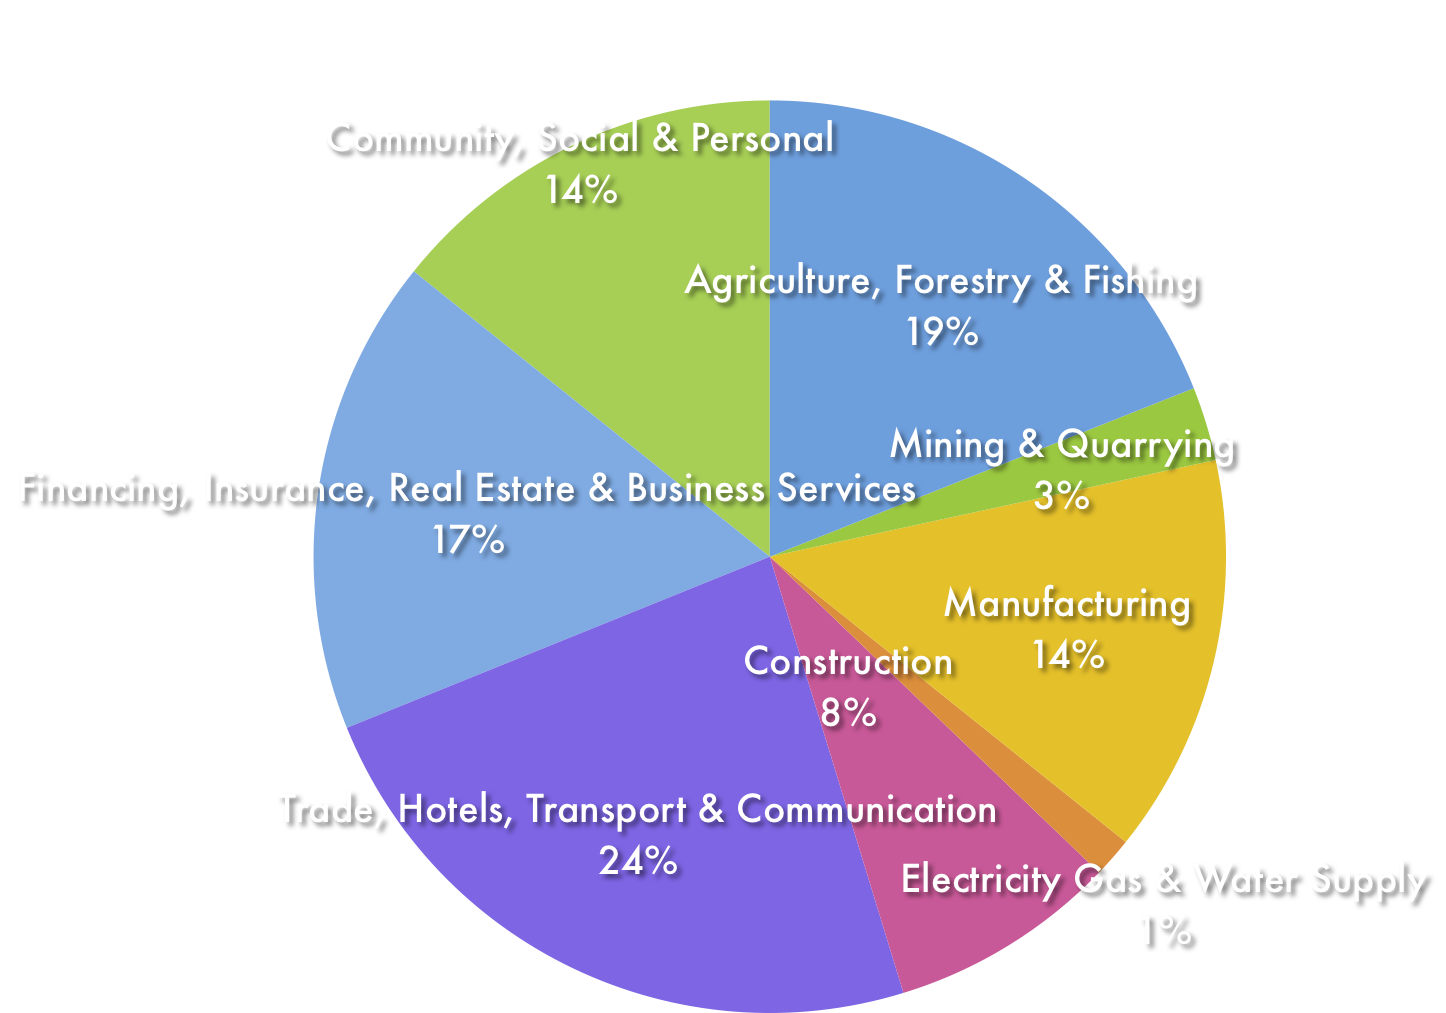
As onemint:A few thoughts on the GDP Numbers says breakup of GDP by economic activity shows
- India went from being primarily an Agriculture economy to a Services economy, and missed the Industrial phase in between
- A 19% agricultural share when close to three quarter of Indians live on agriculture is totally off balance.
- Disparity that exists between Indians today.
- We have one of the fastest growing economies, but we also have an unbelievably high number of people below the poverty line.
- Developing a manufacturing sector is a must to bring millions of people out of poverty, and bridge this huge gap.
Understanding the Growth of Indian Economy
Wiki:Economic History of India covers how Indian Economy has been over the years. Quoting from it:
India has followed central planning for most of its independent history, which have included extensive public ownership, regulation, red tape, and trade barriers. After the 1991 economic crisis, the central government launched economic liberalization. India has turned towards a more capitalist system and has emerged as one of the fastest growing large economies of the world
After independence from 1950’s to 1980’s India had growth rate around 3.5% called as Nehruvian Socialist rate of growth or Hindu rate of growth
Economic liberalization in India in the 1990s led to large changes in the economy.
The graph shows GDP per capita of South Asian economies and South Korea as a percent of the American GDP per capita. Compare India (orange) with South Korea (yellow). Both started from about the same income level in 1950.
Questioning GDP data
Top policy makers, economists, rating agencies have questioned the robustness of the India’s GDP Estimates. Quoting from Times of India:Crisil questions GDP data (Jul 2011)
“Large revisions in GDP estimates in recent years have led to questions on the robustness of these estimates,” said Roopa Kudva, MD & CEO, Crisil. “As the most important economic indicator, GDP estimates influence policy making at the highest level, and hence the need for accurate estimation,” she added. Crisil study finds that the current method of computing GDP underestimates the size and growth of the Indian economy. The Crisil study comes on the heels of RBI governor D Subbarao questioning the series of revisions for a number of crucial data heads that are taken into consideration for major policy decisions, including the key policy rates by the central bank that decide the interest rate in the economy.
Dedication:This post is dedicated to Manshu of onemint.com who explained the concept of GDP’s in very simple terms to his readers and also provided the links to the reports. That helped a non-financial person like me to understand about GDP and even write an article on it.
This article covered Understanding Gross Domestic Product or GDP numbers of India. Who releases the GDP data? What numbers are released? How it is calculated? Interpreting the GDP numbers. We look forward to hearing from you!




4 responses to “Understanding GDP of India”
We Indians, feel that our GDP is good… and its in range of 8.5% (though, now its dropped to 6.5), when compared to developed economies / countries. However, our inflation is equally higher (almost close to double digit).
Whereas, if one compares the developed economies GDP, its always at higher side when compared to inflation. I feel only if this is the case, one can claim it as positive growth.
That’s a very interesting angle. Comparing GDP with inflation. Liked your idea Positive growth means GDP higher than inflation
Incidentally, I had read a realted article “A Gross Mismeasurement?” on ‘the Drucker Exchange’.
The article touches upon a “book excerpt that appears in the Atlantic, economist Umair Haque argues that modern measures of economic performance, most notably that of Gross Domestic Product, miss the mark and are jeopardizing our future.”
“In Haque’s view, things like “human capital, plus social, emotional, and organizational capital” get ignored in measures of GDP, leading to obsessive short-term thinking. “It’s as if we’re pawning our stocks of higher-order capital . . . for cash in hand today,” Haque complains, “but the consequence of such real underinvestment is that we’re left with fewer, poorer assets with which to pioneer opportunities and enjoy higher standards of living tomorrow.” The first step? Ditch GDP (or GNP, as it was once called) for a “better metric.””
Thanks for the information. I shall read it. There would always be debate on any economic indicator (for that matter any thing on earth ). But the question is if not GDP then what?